Measuring execution time in F#
You have probably written code like this in more than one programming language:
let timer = System.Diagnostics.Stopwatch.StartNew()

for i = 0 to 100500 do
  someTask()

timer.Stop()
printfn "elapsed=%O" timer.Elapsed
Writing this boilerplate every time you want a rough performance estimate soon gets tedious. It also leaves room for more reliable measurements. Here are the main improvements I would like:
- Check that the benchmark runs without a debugger attached, in case I forget.
- Verify that the assembly allows JIT optimizations: a Release build with optimizations enabled.
- Give the benchmarking thread a high priority before running the tests.
- Run a garbage collection before each test so that the code samples start under more comparable conditions.
- Choose the iteration count automatically so that tests run long enough to produce useful measurements.
- Optionally correct the results using an empty test to estimate the time spent in the benchmarking infrastructure.
- Support a warmup run so that the code can perform any initial setup before it is measured.
- Repeat the tests and calculate average, minimum, and maximum results.
- Display the results in a table.
- Show progress and allow the user to cancel the benchmark.
Here is the signature of a module that does all of this:
module Measure

/// Performance measurement settings
[<NoEquality; NoComparison>]
type TestOptions =
  { /// Run the garbage collector before and after each test.
    perRunGC: bool
    /// Collect garbage collection counts.
    collectGCStat: bool
    /// Raise the priority of the current thread.
    highPriority: bool
    /// Check the environment for enabled JIT optimizations
    /// and ensure that no debugger is attached.
    checkTestEnv: bool
    /// Display a progress bar
    showProgress: bool
    /// Correct the results for the overhead
    /// of the benchmarking infrastructure
    impactCorrect: bool
    /// Perform a warmup run
    warmIteration: bool
    /// Clear the console before displaying
    /// the next results table.
    clearConsole: bool
    /// Show average results.
    showAverage: bool
    /// Show minimum results.
    showMinimum: bool
    /// Show maximum results.
    showMaximum: bool
    /// Number of iterations. Set to 0 to choose
    /// the iteration count automatically.
    iterationsCount: int
    /// Target benchmark duration. Only used when
    /// the iteration count is set to 0.
    testTime: System.TimeSpan }

/// Default measurement settings
val defaults: TestOptions

/// Measure code performance
val run: (string * (unit -> unit)) list -> unit

/// Measure code performance with the specified settings
val runWithOptions: (string * (unit -> unit)) list -> TestOptions -> unit
And here is the implementation, with comments explaining the details and a few examples of F# language features along the way:
module Measure

open System
open System.Threading
open System.Diagnostics

/// Performance measurement settings
[<NoEquality; NoComparison>]
type TestOptions =
  { perRunGC:      bool ; collectGCStat: bool
    highPriority:  bool ; checkTestEnv:  bool
    showProgress:  bool ; impactCorrect: bool
    warmIteration: bool ; clearConsole:  bool
    showAverage:   bool ; showMinimum:   bool
    showMaximum:   bool ; iterationsCount: int
    testTime:      TimeSpan }

/// Default measurement settings
let defaults =
  { perRunGC      = true ; collectGCStat = true
    highPriority  = true ; checkTestEnv  = true
    showProgress  = true ; impactCorrect = false
    warmIteration = true ; clearConsole  = true
    showAverage   = true ; showMinimum   = false
    showMaximum  = false ; iterationsCount = 0
    testTime = TimeSpan.FromSeconds 3. }

/// Check the benchmark environment
let checkEnvironment() =
  let fail reason =
    let message = "Environment check failed: " + reason
    in raise (InvalidOperationException message)

  // check whether a debugger is attached
  if Debugger.IsAttached then
    fail <| "Benchmarks must be run "
          + "without a debugger attached."

  // check whether the assembly allows optimizations
  let asm = Reflection.Assembly.GetExecutingAssembly()
  for attribute in asm.GetCustomAttributes false do
    match attribute with
    | :? DebuggableAttribute as d ->
      if d.IsJITOptimizerDisabled then
         fail "JIT optimizations are disabled."
      if d.IsJITTrackingEnabled then
         fail "JIT tracking is enabled."
    | _ -> ()

/// Results of a benchmark run
[<ReferenceEquality; NoComparison>]
type TestResult = { time: TimeSpan; gcStat: int[] }

type Console with
  static member Write(color, text) =
    Console.ForegroundColor <- color
    Console.Write(box text)

type con = Console
type color = ConsoleColor

/// Return a function that prints results
let precomputePrinter (names: string list) =
  // highlight results with color
  let highl cond = if cond then color.Yellow
                           else color.DarkYellow
  // compute the name format and culture once
  let longestFrom = Seq.map String.length >> Seq.max
  let format = sprintf "{0,-%d}" (longestFrom names + 3)
  let culture = Globalization.CultureInfo.InvariantCulture

  fun (name: string) (count: int) (results: TestResult list) ->
    let initColor = con.ForegroundColor

    // results table header
    con.ForegroundColor <- color.DarkGray
    con.Write("{0} results ({1} iterations):\n", name, count)

    // fastest elapsed time
    let bestTime = results |> Seq.minBy (fun x -> x.time)
    let bestGC = results // minimum number of collections
              |> Seq.map (fun x -> Array.sum x.gcStat)
              |> Seq.min

    // compare each time with the fastest result
    let bestTicks = float bestTime.time.Ticks
    let factors = List.map (fun result ->
        (float result.time.Ticks / bestTicks)
                     .ToString("F1", culture)) results
    let factorFmt = sprintf "{0,%d}x" (longestFrom factors)

    // print the results table
    for name, result, factor
      in Seq.zip3 names results factors do

      con.Write(color.DarkGray, "\n> ")
      con.ForegroundColor <- color.Gray
      con.Write(format, name) // test name

      // elapsed time, highlighting the minimum
      con.Write(color.DarkGray, " - ")
      con.ForegroundColor <- highl (result = bestTime)
      con.Write result.time

      // time relative to the fastest result
      con.Write(color.DarkGray, " - ")
      con.ForegroundColor <- highl (result = bestTime)
      con.Write(factorFmt, factor)

      // garbage collection statistics
      if result.gcStat <> Array.empty then
        con.Write(color.DarkGray, " - ")
        con.ForegroundColor <- highl (Array.sum result.gcStat = bestGC)

        result.gcStat // print collection counts separated by slashes
        |> Array.fold (fun tail count ->
          if tail then con.Write '/'
          con.Write count; true) false |> ignore

    con.ForegroundColor <- initColor
    con.WriteLine()
    con.WriteLine()

// precompute strings to minimize the progress
// display's impact on garbage collection
let blankLine = String(' ', con.BufferWidth - 1)
let progressLine = Array.init 100 (fun n -> String('.', n))

/// Clear the current line
let clearLine() = con.CursorLeft <- 0
                  con.Write blankLine
                  con.CursorLeft <- 0

/// Display benchmark progress
let printProgress testid count =
  let initColor = con.ForegroundColor
  con.CursorVisible <- false
  con.CursorLeft <- 0

  if count = 0 then clearLine()

  con.Write(color.DarkGray, "test #")
  con.Write(testid: int)
  con.Write(" run")

  if count > 0 && count < 100 then
    con.Write(' ')
    con.Write(progressLine.[count])

  con.CursorVisible <- true
  con.ForegroundColor <- initColor

/// Display a cancellation message
let printCancelled() =
  let initColor = con.ForegroundColor
  con.ForegroundColor <- color.DarkRed
  con.WriteLine("test run stopped")
  con.ForegroundColor <- initColor

/// Run a garbage collection
let inline collectGC() = GC.Collect()
                         GC.WaitForPendingFinalizers()

/// Check whether Escape was pressed
let rec checkEscape () =
  if con.KeyAvailable
    then match con.ReadKey true with
         | с when с.Key = ConsoleKey.Escape -> true
         | _ -> checkEscape()
    else false

/// Calculate average benchmark results
let calcAvarage prevResults count =
  [ for results in prevResults ->
    { time = // calculate the average elapsed time
        let sum = // sum elapsed times
          results |> Seq.map (fun x -> x.time)
                  |> Seq.reduce (+)
        in TimeSpan.FromTicks( // divide by the number of runs
             sum.Ticks / int64 count)
      gcStat = // average garbage collection counts
        // check whether GC statistics are available
        match List.head results with
        | { gcStat = null } -> null
        | _ -> results // sum collection counts
            |> Seq.map (fun x -> x.gcStat)
            |> Seq.reduce (Array.map2 (+))
            |> Array.map (fun x -> x / count) } ]

/// Calculate maximum or minimum results
let calcExtr prevResults max =
  [ for results in prevResults ->
    { time = results |> Seq.map (fun x -> x.time)
                     |> if max then Seq.max else Seq.min
      gcStat = // maximum or minimum collection counts
        // check whether GC statistics are available
        match List.head results with
        | { gcStat = null } -> null
        | _ -> results // compare total collection counts
            |> Seq.map (fun x -> x.gcStat)
            |> if max then Seq.maxBy Array.sum
                      else Seq.minBy Array.sum } ]

/// Measure code performance
/// with the specified settings
let runWithOptions (tests: (string * (unit -> unit)) list)
                   (options: TestOptions) =

  if List.isEmpty tests then
     raise (ArgumentException "tests is empty.")

  // check the benchmark environment
  if options.checkTestEnv then checkEnvironment()

  // save the current thread priority
  let thread = Thread.CurrentThread
  let initPriority = thread.Priority

  let printResults = // result-printing function
    precomputePrinter (List.map fst tests)
  let stopwatch = Stopwatch()
  let gcStat = // allocate storage for GC statistics
    if options.collectGCStat
      then Array.zeroCreate (GC.MaxGeneration + 1)
      else Array.empty

  // run one round of tests
  let rec runTests id count tests results =
    match tests with
    | [] -> List.rev results  // all tests have completed
    | _ when checkEscape() -> printCancelled(); []
    | (_, test) :: left ->
      // calculate the progress step
      let step = match count / 20 with 0 -> 1 | x -> x
      // warm up the test and collect garbage
      if options.warmIteration then test() |> ignore
      if options.perRunGC then collectGC()
      stopwatch.Reset()

      // record garbage collection counts
      if options.collectGCStat then
        for gen = 0 to gcStat.Length - 1 do
          gcStat.[gen] <- GC.CollectionCount gen

      // set the thread priority
      if options.highPriority then
        thread.Priority <- ThreadPriority.Highest

      stopwatch.Start() // measure the test
      if options.showProgress
        then for i = 0 to count do
                 if i % step = 0 then
                    printProgress id (i / step)
                 test() |> ignore
        else for i = 0 to count do
                 test() |> ignore
      stopwatch.Stop()

      let gcStat = // calculate garbage collection counts
        if options.collectGCStat then
          Array.mapi (fun gen count ->
            GC.CollectionCount gen - count) gcStat
        else Array.empty

      // collect garbage after the test
      if options.perRunGC then collectGC()
      clearLine()

      { gcStat = gcStat // record the result
        time = stopwatch.Elapsed } :: results
      |> runTests (id + 1) count left // continue with the remaining tests

    // run tests with overhead correction
    let runWithCorrect count =
      // prepend an empty test
      let tests = ("fake", fun() -> ()) :: tests
      match runTests 0 count tests [] with
      | [] -> [] // the benchmark was cancelled
      | _ :: real as all ->
        // find the fastest test
        let min = List.minBy (fun x -> x.time) all
        let delta = min.time - TimeSpan.FromTicks 1L
        con.WriteLine("delta = {0}", delta)

        // subtract this time from every result
        let fix r = { r with time = r.time - delta }
        in List.map fix real

    // choose the iteration count automatically
    let rec calculateCount top count =
      match runTests 1 count tests [] with
      | []  ->  -1 // the benchmark was cancelled
      | results -> // calculate the total elapsed time
        let summary = results |> List.map (fun x -> x.time)
                              |> List.reduce (+)
        // fraction of the target duration reached
        let perc = float summary.Ticks
                 / float options.testTime.Ticks

        con.CursorTop <- top // return to the first line
        con.Write( // the new line is always longer
          "autotesting: {0:F2}% (iterations: {1})\n",
          perc * 100., count)

        if perc > 0.9 then
          con.CursorTop <- top; clearLine()
          con.WriteLine( // print the final iteration count
            "autotesting completed (iterations: {0})", count)
          count
        else // increase the iteration count
          let delta = int (float count * (1.0 - perc) * 2.)
          if delta = 0 then count * 2 else count + delta
          |> calculateCount top // run the tests again

    // repeat the tests and average the results
    let rec runMany count prev =
      let results = // run with or without overhead correction
        if checkEscape() then printCancelled(); []
        elif options.impactCorrect
          then runWithCorrect count
          else runTests 1 count tests []
      match results, prev with
      | [], _ -> () // the benchmark was cancelled
      | results, [] -> // display the results
        if options.clearConsole then con.Clear()
        printResults "Initial" count results
        runMany count [ for x in results -> [x] ]
      | results, (first :: _ as prev) ->
        if options.clearConsole then con.Clear()
        // add the results to the previous runs
        let prev = List.map2 (fun h t -> h::t) results prev
        // display the current results
        printResults "Test" count results

        if options.showAverage then // average results
          // number of measurements taken
          let measureCount = List.length first + 1
          calcAvarage prev measureCount
          |> printResults "Average" count

        if options.showMinimum then // minimum results
          printResults "Minimum" count (calcExtr prev false)
        if options.showMaximum then // maximum results
          printResults "Maximum" count (calcExtr prev true)

        runMany count prev // continue benchmarking

    let count = // determine the iteration count
      if options.iterationsCount > 0
        then options.iterationsCount
        else calculateCount con.CursorTop 1

    if count > 0 then
      runMany count [] // start the benchmark

      // restore the original thread priority
      if options.highPriority then
        thread.Priority <- initPriority

/// Measure code performance
let run tests = runWithOptions tests defaults
Example output:
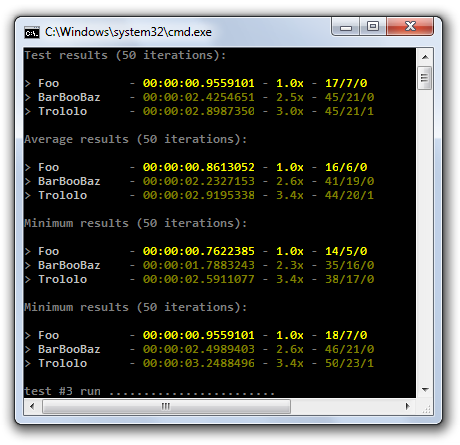
A few notes on the implementation:
- The module exposes two functions:
runandrunWithOptions. The former uses the default settings; the latter accepts aTestOptionsvalue. Both take a list of tuples containing a test name and a function of typeunit -> unit. - You do not need to initialize every field of
TestOptionsto customize the settings. Use F# record copy-and-update syntax with the module’sdefaultsvalue to change only the fields you need:{ Measure.defaults with checkTestEnv = false }. - Press
Escapeto cancel. The key is checked between tests, and the module displays the available results where possible. - The progress display is written to avoid heap allocations, but
System.Consolestill allocates internally. To eliminate that source of interference, disable progress reporting. - The output includes the ratio of each test’s elapsed time to that of the fastest test.
- Run this as a standalone executable outside Visual Studio, rather than in F# Interactive.
For a practical example, let’s compare Printf.sprintf from the F# standard library with string concatenation and System.String.Format:
// values passed through id will not
// be inlined into the code below
let name = id "Alex"
let age  = id 22

// benchmark building a string of this form:
//  "My name is Alex (22 years old)"

Measure.runWithOptions [
  // using string concatenation
  "System.String.Concat", fun()->
    "My name is " + name + " (" + string age + " years old)"
    |> ignore

  // using string.Format
  "System.String.Format", fun() ->
    System.String.Format("My name is {0} ({1} years old)", name, age)
    |> ignore

  // using Printf.sprintf
  "Printf.sprintf", fun() ->
    Printf.sprintf "My name is %s (%d years old)" name age
    |> ignore

    // also show minimum and maximum times
  ] { Measure.defaults with showMinimum = true
                            showMaximum = true }
Here are the results on my Athlon 64 X2 at 2.4 GHz:
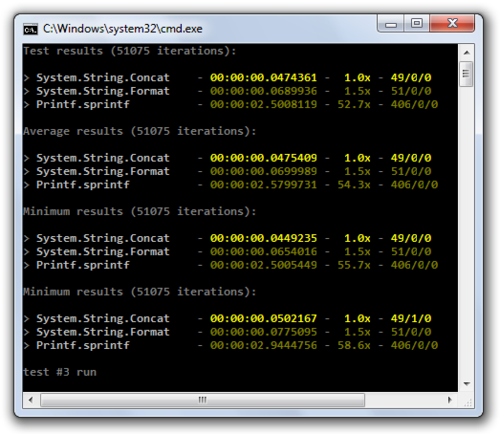
Why is sprintf so much slower here?
There is a cost in the Printf family that is easy to overlook. These functions parse the format string and dynamically construct a formatting function, often with curried arguments. In the sprintf example above, its type is string -> int -> string. Applying the remaining arguments produces output in the console, a string, or a TextWriter, depending on which Printf function you use. Constructing the formatting function takes a significant amount of time. We can avoid repeating that work by computing it once and storing it in a let binding. Let’s modify the benchmark:
let name = id "Alex"
let age  = id 22

let k = Printf.sprintf "My name is %s (%d years old)"

Measure.runWithOptions [
  // using Printf.sprintf
  "Printf.sprintf", fun() ->
    Printf.sprintf "My name is %s (%d years old)" name age
    |> ignore

  // using a precomputed formatting function
  "k = Printf.sprintf", fun() ->
    k name age |> ignore

  ] { Measure.defaults with showMinimum = true
                            showMaximum = true }
The elapsed time is now roughly halved, and the garbage collection counts drop by about a third:
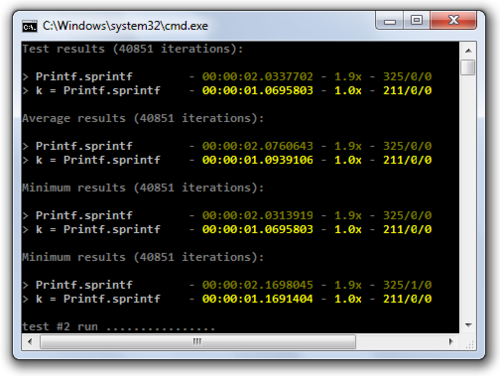
Even with this change, sprintf is more than an order of magnitude slower than String.Format in this benchmark and generates substantially more garbage. In performance-sensitive code, it is worth considering an alternative to Printf, or at least constructing the formatting function once and reusing it.