Goto jump out of the 'try' block: disassembly view
I have always wondered how the following behavior is implemented at the machine-code level:
class Foo
{
  private static void Main()
  {
    bool jump = true;

    Label:
    try
    {
      System.Console.WriteLine("try");
      if (jump)
      {
        jump = false;
        goto Label;
      }
    }
    finally
    {
      System.Console.WriteLine("finally");
    }
  }
}
The output is:
try
finally
try
finally
Leaving a try block, even by jumping backward in the code, must execute the corresponding finally block. I am no assembly expert, but the mechanism turned out to be quite simple:
     4:     static void Main() {
...
     5:         bool jump = true;
00000039  mov         eax,1
0000003e  and         eax,0FFh
00000043  mov         dword ptr [ebp-24h],eax
00000046  nop
     6:
     7:         Label:
     8:         try {
00000047  nop
     9:             System.Console.WriteLine("try");
00000048  mov         ecx,dword ptr ds:[02C32030h]
0000004e  call        641F703C
00000053  nop                   // test the condition
    10:             if (jump) { // to choose how to leave try
00000054  cmp         dword ptr [ebp-24h],0
00000058  sete        al
0000005b  movzx       eax,al
0000005e  mov         dword ptr [ebp-28h],eax
00000061  cmp         dword ptr [ebp-28h],0
00000065  jne         00000083
00000067  nop
    11:                 jump = false;
00000068  xor         edx,edx
0000006a  mov         dword ptr [ebp-24h],edx
    12:                 goto Label;
0000006d  nop
0000006e  mov         dword ptr [ebp-1Ch],0     // prepare to leave try
00000075  mov         dword ptr [ebp-18h],0FCh  // and save the target below
0000007c  push        3C012Dh // <== jump target @ 00000047
00000081  jmp         0000009A
    13:             }
    14:         }
00000083  nop
00000084  nop
00000085  mov         dword ptr [ebp-1Ch],0
0000008c  mov         dword ptr [ebp-18h],0FCh // or continue after finally
00000093  push        3C0136h  // <== jump target @ 000000ac
00000098  jmp         0000009A
    15:         finally {
0000009a  nop
    16:             System.Console.WriteLine("finally");
0000009b  mov         ecx,dword ptr ds:[02C32034h]
000000a1  call        641F703C
000000a6  nop
    17:         }
000000a7  nop              // after finally, always
000000a8  pop         eax  // pop the address off the stack
000000a9  jmp         eax  // and jump to it
000000ab  nop
    18:
    19:         Debugger.Break();
000000ac  call        64700020
000000b1  nop
    20:     }
...
For a jump out of the try block, the JIT compiler emits a jump after finally to an address taken from the top of the stack. It also ensures that every exit from try pushes the address at which execution should resume. The same mechanism handles break, continue, and return inside try { }.
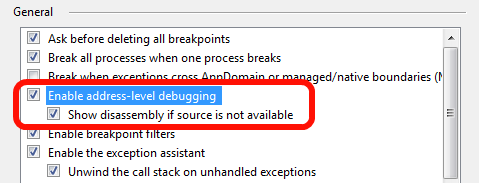
How do you inspect the actual machine code generated for managed code? First, enable address-level debugging in Visual Studio:
Insert a call to System.Diagnostics.Debugger.Break() and build the project in Release mode. If you want to see how C# source lines correspond to machine instructions, disable compiler optimizations. These operate at the MSIL level and have a relatively small effect on the resulting machine code:
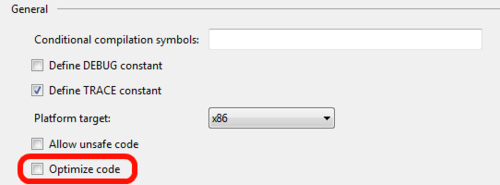
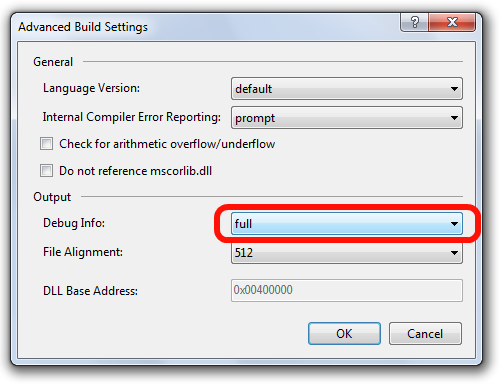
With C# compiler optimizations enabled, you will see the fully optimized disassembly, but you will have to work out the correspondence yourself. In either case, generate full debug information:
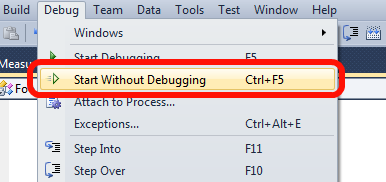
Run the program without a debugger attached so that JIT optimizations are enabled:
When execution reaches Debugger.Break(), choose to debug the program:
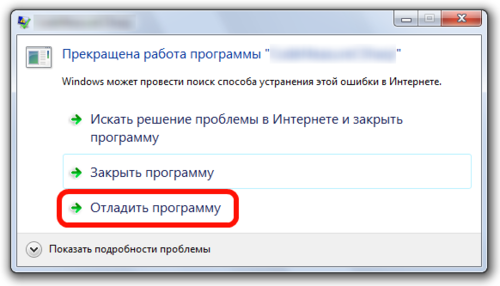
Attach the appropriate instance of Visual Studio and choose Go to Disassembly from the context menu. You can now inspect the generated instructions. There are a couple of details to keep in mind:
- Some methods may not have been JIT-compiled yet. Arrange for the code you want to examine to run at least once before attaching the debugger. Alternatively, use the static
PrepareMethodmethod onSystem.Runtime.CompilerServices.RuntimeHelpersto trigger JIT compilation explicitly. -
Inlining can also make the code harder to inspect. You can prevent a particular method from being inlined by applying
MethodImplAttributefrom the same namespace:using System.Runtime.CompilerServices; class Foo { [MethodImpl(MethodImplOptions.NoInlining)] public static void NoInline() { } }